Example
Three-Generation Genogram Example: The Kowalski-Walker Family
A worked three-generation genogram example with a fictional Polish-American family. Covers placement, relationship lines, medical annotations, and how to read what the diagram reveals.
Updated April 20268 min readWorked Genogram Example ↓
This example walks through the process of drawing and reading a three-generation genogram for a fictional family — the Kowalski-Walkers. The family is imagined but plausible: a Polish-American family spanning from post-war immigration to the present, with the kinds of patterns — health conditions, relationship dynamics, intergenerational tensions — that appear in real family histories.
Real families are more complex than any diagram. This example is meant to illustrate the method, not to suggest that a genogram captures everything. The diagram is a map, and like all maps, it simplifies in order to reveal. You can also explore this genogram interactively in FamRoots.
The Family
Generation 1 (Grandparents)
Paternal side: Stanisław Kowalski (born 1928, Warsaw) immigrated to Chicago in 1952. He married Helena Wierzbicka (born 1930, also Warsaw) in 1955. Stanisław worked in a steel mill; he died in 1991 of a heart attack at 63. Helena, now 94, lives with her son. Stanisław had hypertension from his late 40s; Helena has type 2 diabetes, diagnosed at 68.
Maternal side: Walter Walker (born 1932, Detroit) married Ruth Anne O'Brien (born 1935, Detroit) in 1957. Walter worked in automotive manufacturing; Ruth Anne worked as a school secretary. Walter died in 2004 of lung cancer (smoker); Ruth Anne died in 2018 of Alzheimer's disease. The Walker marriage was functional but described by their daughter as "cold."
Generation 2 (Parents)
Thomas Kowalski (born 1958, Chicago) is the index person's father. He has one brother, Marek, born 1961. Thomas married Janet Walker (born 1960, Detroit) in 1985; they divorced in 2002. Thomas remarried in 2006 — his second wife, Diane, born 1965, has two children from a previous marriage. Thomas was treated for depression in his 40s; he has borderline hypertension but does not take medication.
Janet Walker Kowalski remarried in 2008 to David Chen (born 1957). Janet has anxiety, formally diagnosed in 2001 around the time of the divorce. She describes her relationship with her mother Ruth Anne as close but complicated.
Marek Kowalski (born 1961) never married. He had a long-term relationship that ended in his 30s; his family describes him as "private." He was treated for alcohol use disorder at 45 and has been in recovery since.
Generation 3 (The Index Person and Siblings)
Sarah Kowalski (born 1987) is the index person for this diagram. She has one younger brother, Daniel (born 1990). Sarah and Daniel grew up primarily with their mother Janet after the 2002 divorce. Sarah has described her relationship with her father Thomas as "distant but improving." She entered therapy at 29, initially for anxiety, and the genogram work began there.
Daniel Kowalski (born 1990) is in a long-term relationship with Marcus, born 1989. They do not have children. Daniel has struggled with periods of significant depression; he and his father have a close relationship.
Drawing the Structure
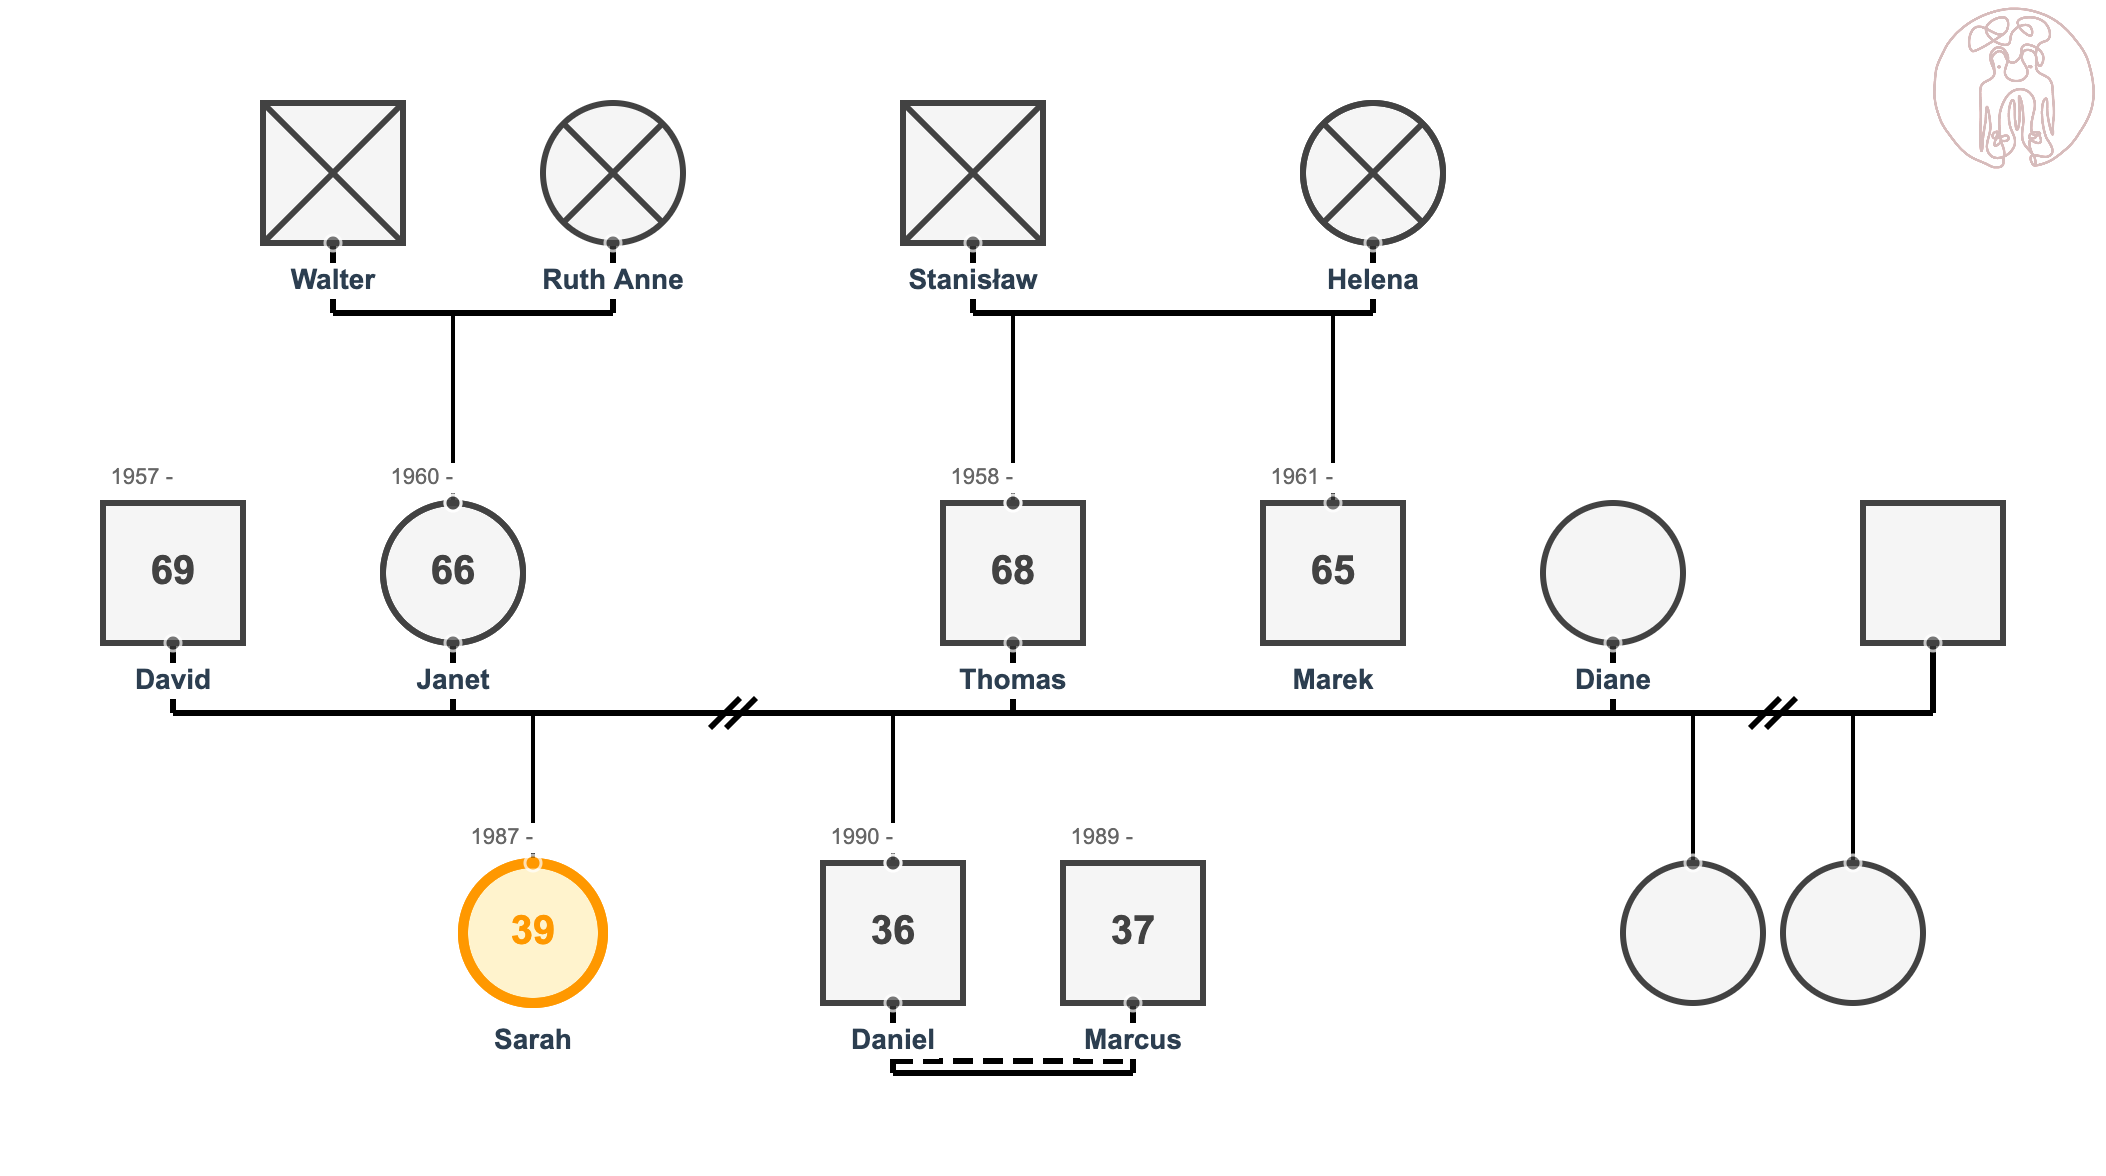
Starting from the top:
Row 1: Two couples at the grandparent level. Walter (†) and Ruth Anne (†) on the left (maternal side). Stanisław (†) and Helena on the right (paternal side). Marriage lines are solid horizontal lines; deceased members are marked with an X through their symbol.
Row 2: From left to right: David (Janet's second husband), Janet, Thomas, Marek, Diane (Thomas's second wife) with her two children from a previous marriage. Thomas and Janet are connected by a horizontal line with two diagonal slashes (divorce, 2002). Janet has a second line connecting to David on her left. Thomas has a second line connecting to Diane on his right. Marek appears to the right of Thomas, connected to his parents by the sibship line above.
Row 3: Sarah (double-bordered circle — the index person) on the left, with Daniel and his partner Marcus to the right, hanging from the sibship line below Thomas and Janet.
At this point the structure is complete. The diagram shows three generations, four partnerships, two divorces, and two remarriages, plus one sibling (Marek) with no partnership.
Adding Relationship Quality Lines
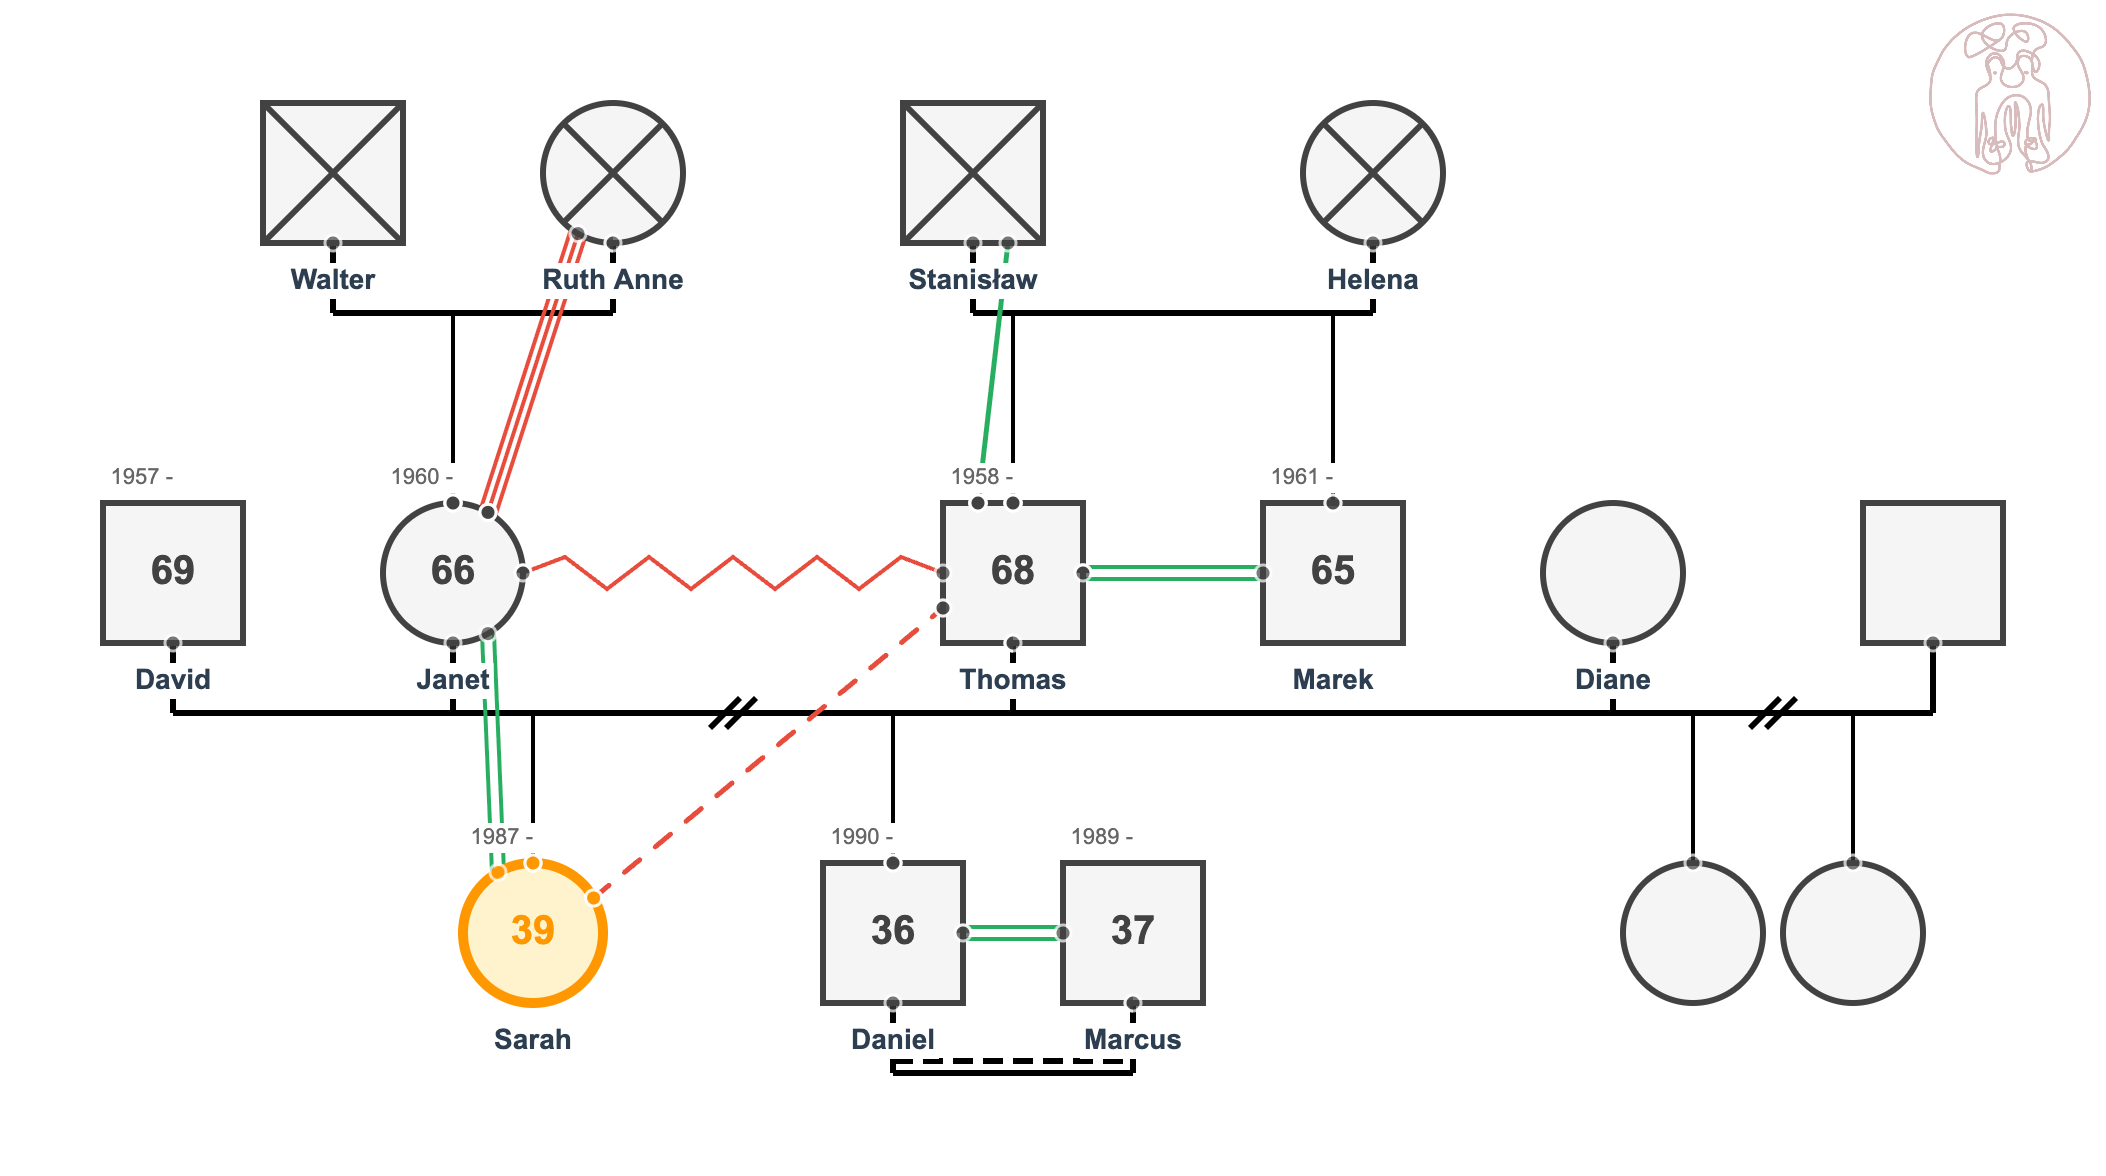
Now draw the relationship quality lines directly between individuals:
- Sarah and her mother Janet: double line (very close, sometimes enmeshed)
- Sarah and her father Thomas: dashed line (distant, with notation "improving")
- Thomas and Marek: double line (close brothers, significant support during Marek's recovery)
- Janet and Ruth Anne (her mother): line with hash marks (complex closeness, fused)
- Stanisław and his son Thomas: solid line (normal relationship in retrospect; Stanisław died when Thomas was 33)
- Thomas and Janet: zigzag line through the divorce slash (conflicted during the marriage and through the divorce)
These lines are added in a second pass, ideally in a different color from the structural lines, so they do not visually merge with the family structure.
Medical Annotations
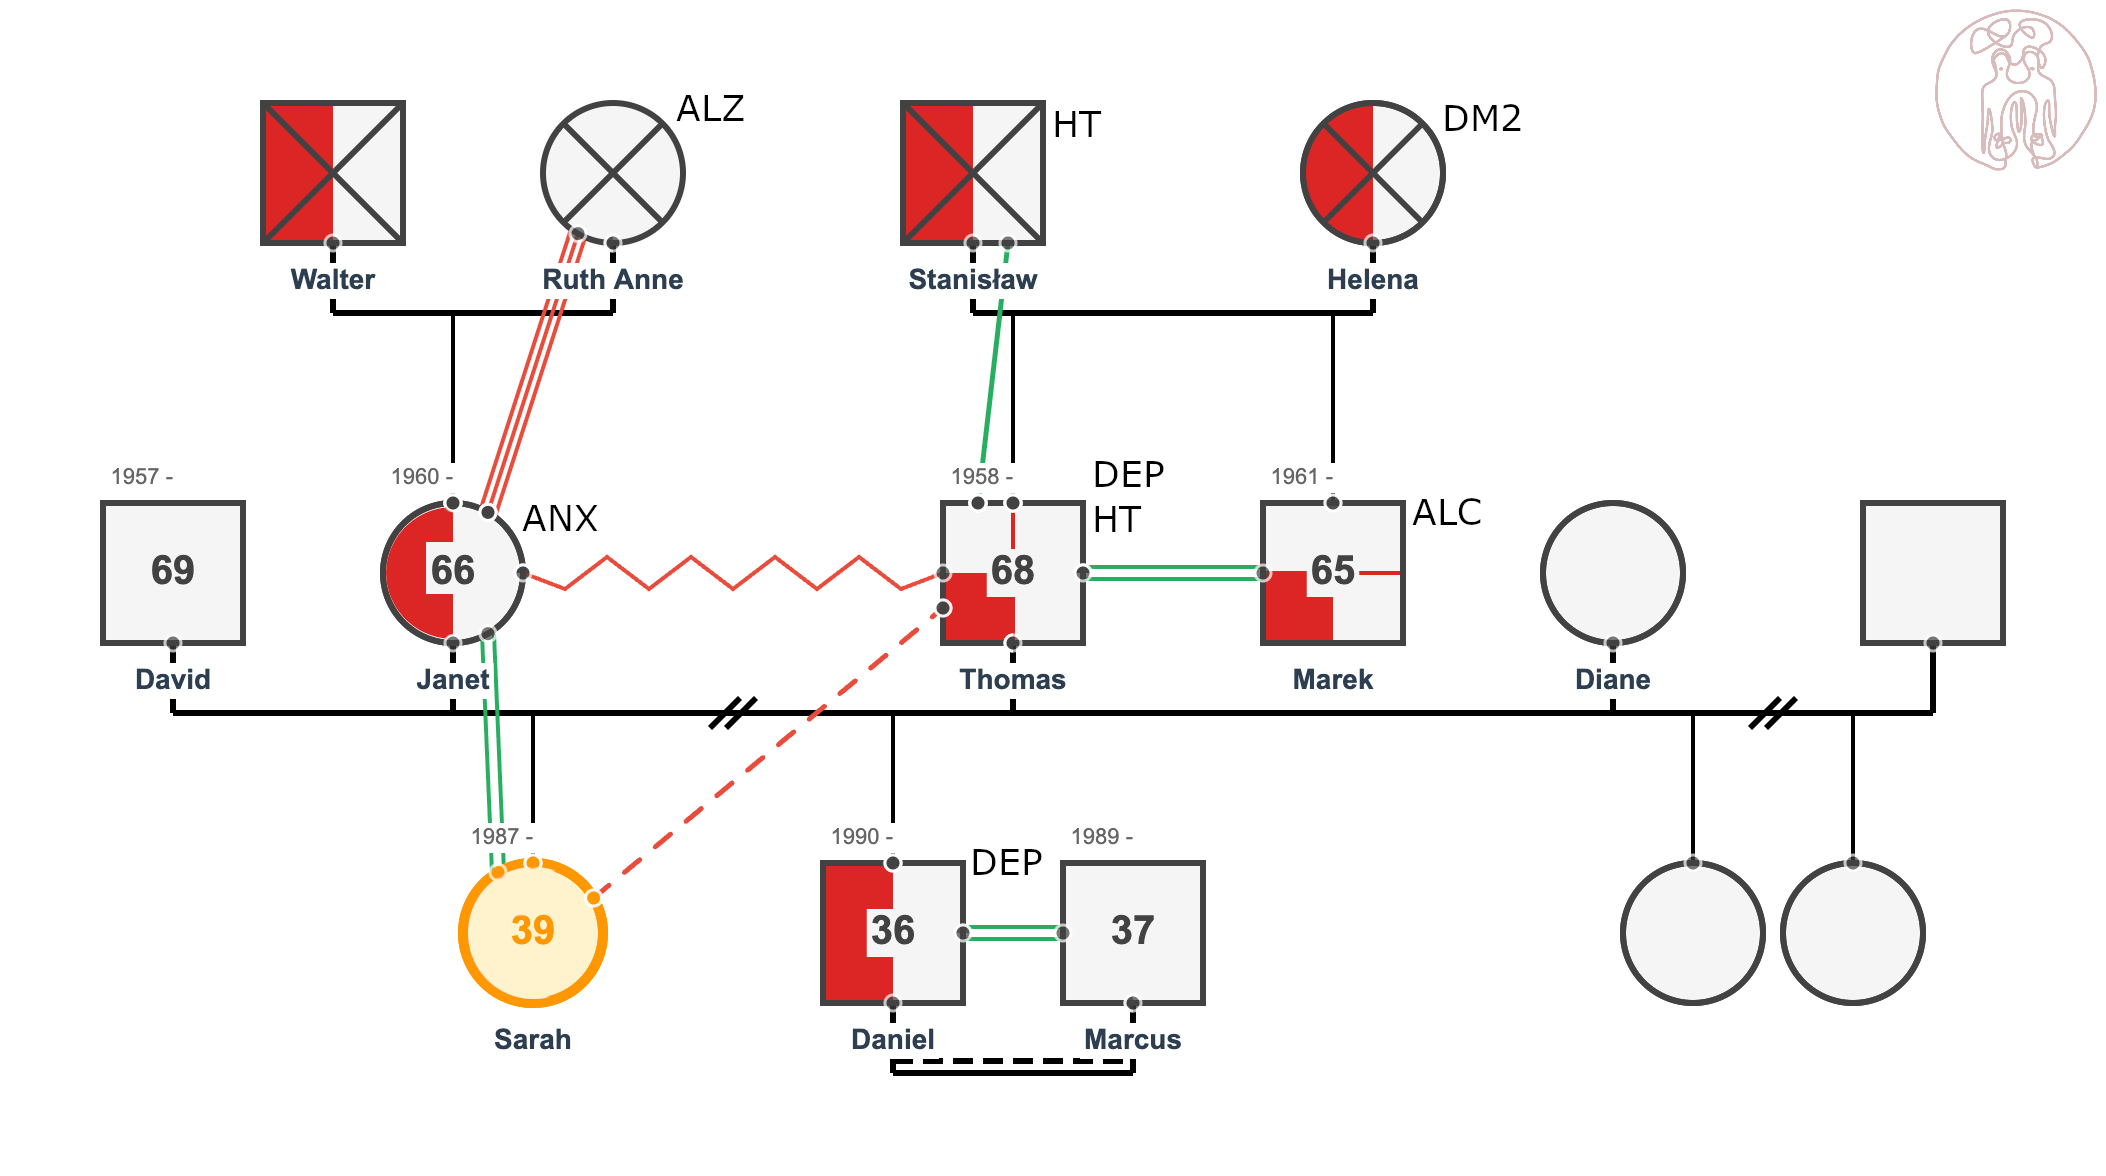
Mark medical conditions inside or beside each symbol, with age of onset where known:
- Stanisław: HT (hypertension, ~48), cause of death heart attack, age 63
- Helena: DM2 (type 2 diabetes, ~68)
- Walter: lung cancer, smoker; cause of death noted below his symbol
- Ruth Anne: ALZ (Alzheimer's disease, onset in her late 70s)
- Thomas: DEP (depression, treated ~48), HT (borderline, unmedicated)
- Marek: ALC (alcohol use disorder, treated 45, in recovery)
- Janet: ANX (anxiety, diagnosed 2001)
- Daniel: DEP (recurrent depression, onset in his 20s)
Reading the Completed Diagram
A completed genogram is not its own interpretation — it is a set of questions in visual form. Here is how a clinician or an engaged reader might move through this one.
Cardiovascular pattern on the Kowalski side. Stanisław died of a heart attack at 63; Thomas has borderline hypertension in his late 50s. Two generations, same line, similar trajectory. This is worth noting both medically (Thomas should be monitored) and clinically (the fear of following the father's path may be part of Thomas's emotional presentation).
Mood and anxiety clustering. Depression appears in Thomas, Daniel, and is suggested in Marek's alcohol use disorder (comorbid depression is common in alcohol use disorder in clinical presentations). Anxiety appears in Janet. Sarah entered therapy for anxiety. A clinician looking at this diagram sees mood vulnerability as a thread running through multiple family members across both sides.
Marek. He is 63, never married, a long history that the family describes with the vague "private." His alcohol use disorder was treated at 45 — mid-life, which often surfaces in response to unresolved earlier material. The enmeshment of Stanisław and Helena's generation with their Polish-immigrant context, the masculine stoicism that may have been the family's adaptation to displacement and difficult work — these are worth exploring.
Sarah's position. She is the eldest child of a conflicted marriage that ended in her mid-teens. Her closest relationship is with her mother, which is also described as enmeshed. Her relationship with her father is distant. She entered therapy at 29 — a common timing for when early family-of-origin material surfaces in earnest. The genogram does not explain why she came to therapy; it contextualizes the territory.
The Walker side. Walter and Ruth Anne's marriage was described as "cold." Janet learned about intimacy in that household. Her anxiety was formally diagnosed around the time of her divorce from Thomas, but given what she grew up with, the soil for that anxiety was prepared well in advance.
Questions the Diagram Generates
A good clinical reading of a genogram does not stop at what the symbols say — it identifies the questions worth asking next. For the Kowalski-Walker family:
Why 48? Thomas's depression emerged at 48 — the same age Stanisław began developing the hypertension that preceded his death at 63. Thomas is 62 now. Whether consciously or not, he is in the same developmental moment his father was when his health began to deteriorate. That parallel is worth naming in clinical work.
What happened to Marek? He is 63, never formed a lasting partnership, treated alcohol use disorder at 45, described as "private." The family's description is not an explanation. Something organized his life in a particular direction. A clinician working with Sarah might never see Marek, but his story is part of the system she came from.
Sarah's enmeshment with Janet. The double line between them is a clinical hypothesis, not a diagnosis. What does it mean for Sarah's functioning? In what ways does she organize herself around her mother's wellbeing or emotional state? These are questions the genogram asks; only the person can answer them.
The Walker marriage. Walter and Ruth Anne's marriage was "cold." Janet learned about partnership in that household. Her first marriage to Thomas was conflicted. Her anxiety emerged most acutely around the time of the divorce. The through-line is not inevitable, but it is there to examine.
What the Diagram Does Not Show
This genogram captures patterns that can be symbolized: medical history, formal relationship status, the broad emotional texture of relationships. It does not capture the specifics.
It does not capture what Stanisław thought about when he worked the night shift in 1967. It does not capture what Janet's childhood home felt like in December, or what Ruth Anne was like before the dementia took hold. It does not capture the reason Thomas's depression emerged at 48 rather than earlier or later.
A genogram is a starting point. The map is not the territory. Real families are more complex than any diagram, and the value of the diagram is not in its completeness but in its ability to make certain patterns visible enough to ask questions about them.
Working on your own family system? The interview questions guide offers a structured framework for gathering the information that goes into a diagram like this one. For the drawing process step by step, the how-to-draw guide covers placement, symbols, and annotation conventions.
FamRoots makes it straightforward to take a diagram like this one from sketch to a shareable digital form, with notation that follows the current McGoldrick standard. You can view the Kowalski-Walker genogram in FamRoots to explore it interactively.
Free download
Free Worked Genogram Example
A fully annotated three-generation genogram example with explanations for every symbol and relationship line.
Read next
How to Draw a Genogram: Step-by-Step Guide
Learn how to draw a genogram from scratch. This guide covers gathering information, choosing the index person, placing generations, and adding relationship markers.
Genogram symbols, explained
A complete reference to standard genogram notation: shapes, lines, medical markers, and the conventions clinicians actually use. With a free downloadable cheat sheet.
When you're ready
Build your genogram with FamRoots
A guided experience for transforming family history into healing narrative, built by the same team behind these resources. Pay per genogram, not per month.