Free guide
How to Draw a Genogram: Step-by-Step Guide
Learn how to draw a genogram from scratch. This guide covers gathering information, choosing the index person, placing generations, and adding relationship markers.
Updated April 20268 min readBlank Genogram Template ↓
A genogram maps family relationships, health history, and behavioral patterns across three or more generations. Unlike a family tree, it records the emotional quality of each bond, the illnesses in each generation, and the behavioral patterns that passed down before anyone named them.
This guide walks you through drawing one from scratch, whether you are working with pen and paper, a whiteboard, or digital tools.
Before You Draw: Gather Your Information
The quality of a genogram depends on the information behind it. Before placing a single symbol, collect data for at least three generations.
For each person, aim to record:
- Full name and dates (birth, death, marriage, divorce)
- Cause of death where known
- Medical history: conditions with hereditary significance (cardiovascular disease, certain cancers, diabetes, mental health diagnoses)
- Behavioral patterns: substance use, trauma, periods of estrangement
- Relationship quality: who was close to whom, who was in conflict, who cut contact
You will not have complete information for everyone. That is expected. A genogram with question marks is more honest than one with confident guesses. Mark unknowns with a "?" rather than leaving a field blank — it distinguishes "we don't know" from "we didn't ask."
For a practical framework on gathering this information from family members, see the guide on genogram interview questions.
The Index Person: Where the Map Centers
Every genogram has an index person — the person whose family system you are mapping. In clinical practice, this is usually the person presenting for therapy. In family research, it might be whoever you are investigating. In personal use, it is often yourself.
The index person anchors the diagram. Their generation sits at the visual center. Everything above shows their family of origin; everything below shows the family they formed.
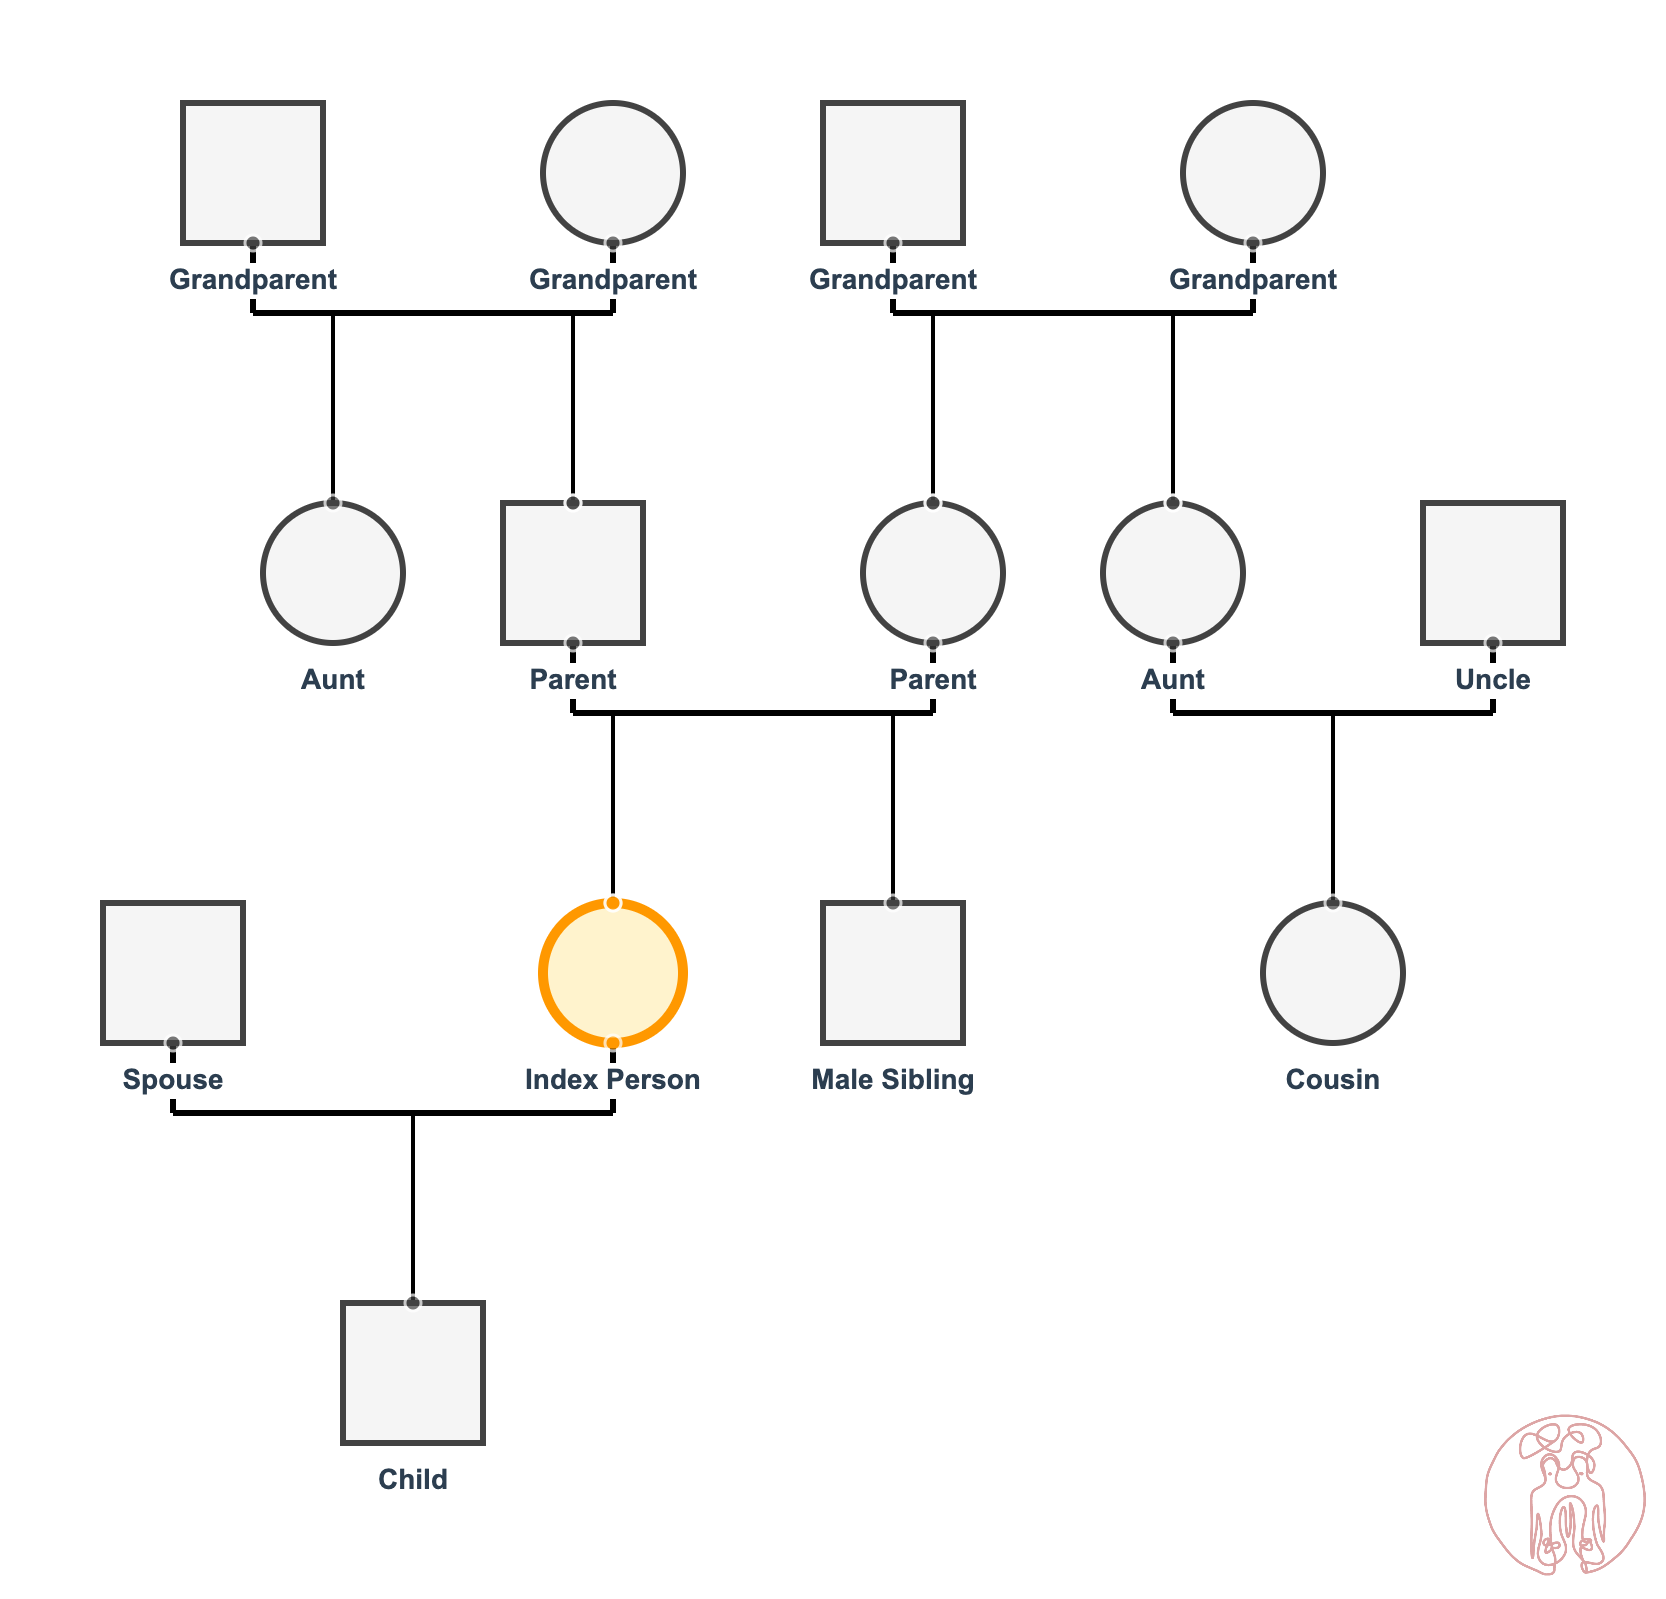
Conventionally, the index person is shown with a double border — a square with a second line around it for males, a circle within a circle for females. This makes them easy to locate at a glance.
Place the index person somewhere left-of-center on your page, leaving room to add a partner or spouse to their right.
Placing Generations
A genogram reads top to bottom, with the oldest generation at the top:
- Row 1 (top): Grandparents
- Row 2: Parents, aunts, uncles
- Row 3: The index person and their generation (siblings, cousins of the same generational tier)
- Row 4 (below): Children of the index person, if any
Each generation occupies a horizontal band. Leave enough vertical space between rows to draw the connecting lines without crowding.
Drawing Couples
A horizontal line between two symbols shows a committed relationship. The standard convention:
- Married couple: solid horizontal line
- Divorced or separated: two diagonal slashes through the line (//)
- Unmarried partnership (cohabiting): dashed horizontal line
The year of marriage, divorce, or separation is written above or below the relationship line.
Drawing Parents and Children
A vertical line drops from the middle of the couple's horizontal line down to a horizontal sibship line. Each child hangs from this sibship line with a short vertical connector.
Older children are placed to the left; younger children to the right, following birth order. If twins exist, their vertical lines converge to a point before joining the sibship line.
Deceased Members
Place an X through the symbol of a deceased person. Write the cause of death below their symbol and the year of death next to their birth year inside or below the symbol.
Adding Relationship Quality Lines
The lines between family members show the emotional quality of each relationship. This is what distinguishes a genogram from a family tree.
Standard relationship line types:
| Line type | Relationship |
|---|---|
| Single solid line | Normal / functional |
| Double line | Very close, sometimes enmeshed |
| Dashed line | Distant or peripheral |
| Zigzag | Conflicted or hostile |
| Broken line | Estranged or cut off |
| Line with hash marks | Fused (emotionally undifferentiated) |
These lines are drawn directly between individuals, not along the structural lines of the diagram. A daughter who is enmeshed with her mother, for example, gets a double line connecting their symbols directly.
It helps to draw the structural skeleton of the genogram first — all the symbols and generational lines — and then add relationship quality lines in a second pass with a different color.
Handling Blended Families and Complex Structures
Modern family structures rarely fit the two-parent, same-generation template. Remarriages, half-siblings, adoptions, same-sex partnerships, and non-marital partnerships all require care.
Remarriages. When a parent has had multiple partners, each partner appears to one side. Convention places current or most recent partnerships closer to center. Children from different partnerships hang from the sibship line below the relevant parental union, not below the individual parent. This matters: a child whose parents were never together still needs to connect to both biological parents on the diagram.
Half-siblings. They share one parent and appear on the same generational row as full siblings, but their sibship lines connect to different parental unions. A half-sibling through the father hangs from the father's first (or second) union, while the index person's full siblings hang from the marriage to the mother.
Adoption. Adoptive relationships are shown with a dashed line dropping from the adoptive couple to the child, rather than a solid line. Biological parents, if known, may appear in a separate cluster with a dotted sibling line connecting to the adoptee, or may be noted as unknown.
Same-sex partnerships. Current notation uses the same horizontal line convention as heterosexual couples. Gender is encoded in the shape (square vs. circle), not in the relationship line. Two squares connected by a horizontal line is a male same-sex couple. Two circles, a female same-sex couple.
When a diagram becomes visually crowded — multiple remarriages, large sibships, stepchildren — it helps to use a separate sheet or digital tool that allows you to zoom and reposition. The goal is legibility. An accurate diagram nobody can read helps no one.
Adding Medical and Behavioral Annotations
Most medical and behavioral annotations go inside the person's symbol or written close beside it:
- A small letter abbreviation for a condition: HT for hypertension, DM for diabetes, ALC for alcohol use disorder
- The age of onset written as a superscript number
- A shaded half-symbol to indicate a behavioral pattern (e.g., lower half shaded = substance use)
For consistency with clinical notation, see the McGoldrick notation system and the full symbol reference for the current standard abbreviations.
When to Use Paper vs. Digital Tools
A first-pass genogram almost always works better on paper. You can sketch, erase, and rethink without committing to positions early. Placing people on a page, deciding who goes near whom, engages spatial thinking that can surface insights before the formal diagram is complete.
The limitations of paper show up during revision. When you learn that a grandparent had a significant relationship you did not know about, or when a family member provides new medical information, a paper diagram can quickly become illegible. Digital tools are better for the version you share or archive.
If you are working with a therapist, a digital genogram is more practical for sessions held remotely and for sharing with other members of the care team. If you are working independently for personal exploration, paper for the first version and digital for the reference copy is a common and sensible pattern.
Checking Your Work: Common Beginner Mistakes
Generations on the same horizontal level. When family lines get complicated — remarriages, half-siblings, blended families — symbols sometimes drift onto the wrong row. Step back and confirm that every person sits on the correct generational tier. The index person's generation should all share the same horizontal band.
Confusing structural lines with relationship quality lines. Structural lines (the ones connecting parents to children, couples to each other) carry specific meanings about family structure. Relationship quality lines carry emotional meaning. Draw them in different colors if the diagram is getting dense.
Leaving out deceased members. A genogram that omits grandparents who died before you were born misses critical information. The patterns that shaped your parents started before you arrived.
Over-annotating a first draft. Draw the structure first. Add annotations second. Trying to do both at once leads to messy diagrams that are hard to revise.
Forgetting birth order. If siblings are placed randomly on the sibship line, you lose potentially useful information. Birth order is a meaningful variable in family systems work.
Working with Incomplete Information
Families have gaps. People die without passing down their histories. Topics were considered too painful to discuss. Some members are simply unknown.
A genogram is a living document. You add to it as you learn more. Start with what you know and mark gaps explicitly. What you do not know can be as informative as what you do.
If you are drawing a genogram from memory, consider beginning with your own generation and immediate family, then scheduling a conversation with older relatives before attempting to fill in the generations above. The interview questions guide offers a structured framework for those conversations.
What the Completed Diagram Reveals
A finished three-generation genogram tends to surface two or three patterns that were not visible before. Sometimes it is noticing that most people on one side of the family died before 70 from cardiovascular disease. Sometimes a relationship dynamic keeps appearing in the same line. These are starting points for reflection or clinical work, not explanations.
If you are drawing a genogram in a therapeutic context, bring the completed diagram to your next session rather than analyzing it alone. A trained clinician can see patterns in a genogram that the person who drew it cannot, precisely because the person is inside the system the diagram describes.
For an extended example of how a clinician reads a completed diagram, the three-generation example walks through a fictional family and shows the kinds of questions a completed genogram generates.
Starting Your Own
A blank genogram template is available as a free download if you want a structured starting point — it includes pre-drawn symbol legends and a three-generation grid with space for annotations.
Once the structure is in place, FamRoots lets you move from a paper sketch to a shareable digital genogram, useful when working with a therapist, genetic counselor, or a family spread across multiple households.
For the next step after drawing, the three-generation example walks through how to read what your completed diagram reveals.
Free download
Free Blank Genogram Template
A printable blank genogram template for three generations. Perfect for hand-drawing your first genogram.
Read next
Genogram symbols, explained
A complete reference to standard genogram notation: shapes, lines, medical markers, and the conventions clinicians actually use. With a free downloadable cheat sheet.
Genogram Interview Questions: What to Ask Your Family
Collecting information for a genogram requires asking the right questions. This guide provides 40+ interview questions covering family structure, medical history, relationships, and sensitive topics — with trauma-informed framing.
When you're ready
Build your genogram with FamRoots
A guided experience for transforming family history into healing narrative, built by the same team behind these resources. Pay per genogram, not per month.